Before you start downloading apps or tinkering with settings, it helps to speak the language of Wi-Fi. The core metric you need to know is decibels per milliwatt, or dBm. It’s always a negative number, and the rule is simple: the closer that number gets to zero, the stronger your Wi-Fi signal.
Decoding Wi-Fi Signal Numbers
When you measure your Wi-Fi, you’re looking at its raw power level. This value is technically called the Received Signal Strength Indicator (RSSI), which is just a fancy way of saying how much juice your device is getting from the router. While RSSI can be measured in a few different ways, it's almost always expressed in dBm to keep things consistent.
Think of it like temperature. A signal of -50 dBm is fantastic—like a warm, sunny day. At this strength, 4K streaming and online gaming will feel effortless. On the other hand, a signal of -75 dBm is weak and getting chilly. That's when your video calls start to stutter and downloads move at a snail's pace.
It's a common mistake to think Wi-Fi signal is the same as internet speed, but they're two very different things. You can have a perfect connection to your router (strong Wi-Fi) but a slow pipeline to the outside world (slow internet). To get a better handle on this, check out our guide on the difference between Wi-Fi and the internet: https://clouddle.com/blog/difference-in-wifi-and-internet/
What Do the Numbers Actually Mean?
To give you a practical feel for these numbers, here's a quick reference guide to what you can expect at different signal strengths.
WiFi Signal Strength Quality Guide (dBm)
| dBm Value | Signal Quality | What It's Good For |
|---|---|---|
| -30 to -50 dBm | Excellent | Anything you can throw at it. Perfect for 4K streaming, competitive gaming, and large file transfers. You're likely right next to the router. |
| -51 to -67 dBm | Very Good | A solid, reliable connection for most homes. Great for HD streaming, smooth video calls, and everyday browsing. |
| -68 to -75 dBm | Fair | The "good enough" zone. You can browse the web and stream, but you might run into buffering or slowdowns. |
| -76 dBm & below | Poor | You're on the edge of a connection dropout. Web pages will load slowly, and you'll likely experience frustrating lag or disconnects. |
These numbers tell a clear story about your connection's stability and potential performance.
Here's a pro tip: The dBm scale is logarithmic, not linear. This means a drop of just 3 dBm cuts your signal power in half. So, going from -60 dBm to -63 dBm is a much bigger deal than it sounds.
Once you understand these values, you're no longer guessing based on the Wi-Fi bars on your screen. You have hard data to pinpoint weak spots and start making targeted improvements to your network. As technology advances, understanding these fundamentals becomes even more crucial, especially with next-gen Wi-Fi technologies like Wi-Fi 6 demanding stronger, more stable connections.
Checking Your Wi-Fi Signal Strength on Windows
If you're using a Windows machine, finding your true Wi-Fi signal strength is pretty straightforward. That little five-bar icon in the taskbar is a decent at-a-glance indicator, but it doesn't give you the hard numbers you need to actually troubleshoot a spotty connection.
The good news is you have options, from a quick check using tools already built into Windows to more powerful, specialized software for a deeper dive.
The Quick and Dirty Method: Command Prompt
For a fast, no-frills reading, you don't need to install a thing. Windows has a built-in command that can give you a pretty good idea of your signal quality as a percentage. It's my go-to for a quick spot-check.
Here’s how to do it:
- Pop open the Start Menu and just type "cmd" to bring up the Command Prompt.
- In the window that appears, type this exact command:
netsh wlan show interfaces - Hit Enter, and you'll see a bunch of text. Look for the line that says "Signal."
The percentage you see there is a direct snapshot of your signal quality. Anything 90% or higher is fantastic. If you see it dipping below 75%, you're likely in a spot where you'll start noticing slowdowns or drops.
Pro Tip: Don't just check it once. Wi-Fi signals fluctuate as people walk by or other devices start talking. Run the command a few times over a minute or so to get a reliable average.
For a Deeper Dive: Third-Party Apps
When a simple percentage isn't enough, it's time to bring in the big guns. Dedicated Wi-Fi analysis tools like NetSpot or inSSIDer are designed for this exact purpose, and they give you a much richer picture of what's happening.
These apps go way beyond a single number. They scan for all the Wi-Fi networks your computer can see and show you their signal strength in dBm, which channels they're on, their security setup, and more. This is incredibly useful for spotting issues like channel interference—a classic reason for slow Wi-Fi even when your signal bars look full.
This chart is a great cheat sheet for translating those raw dBm (or RSSI) numbers into what they actually mean for your connection quality.
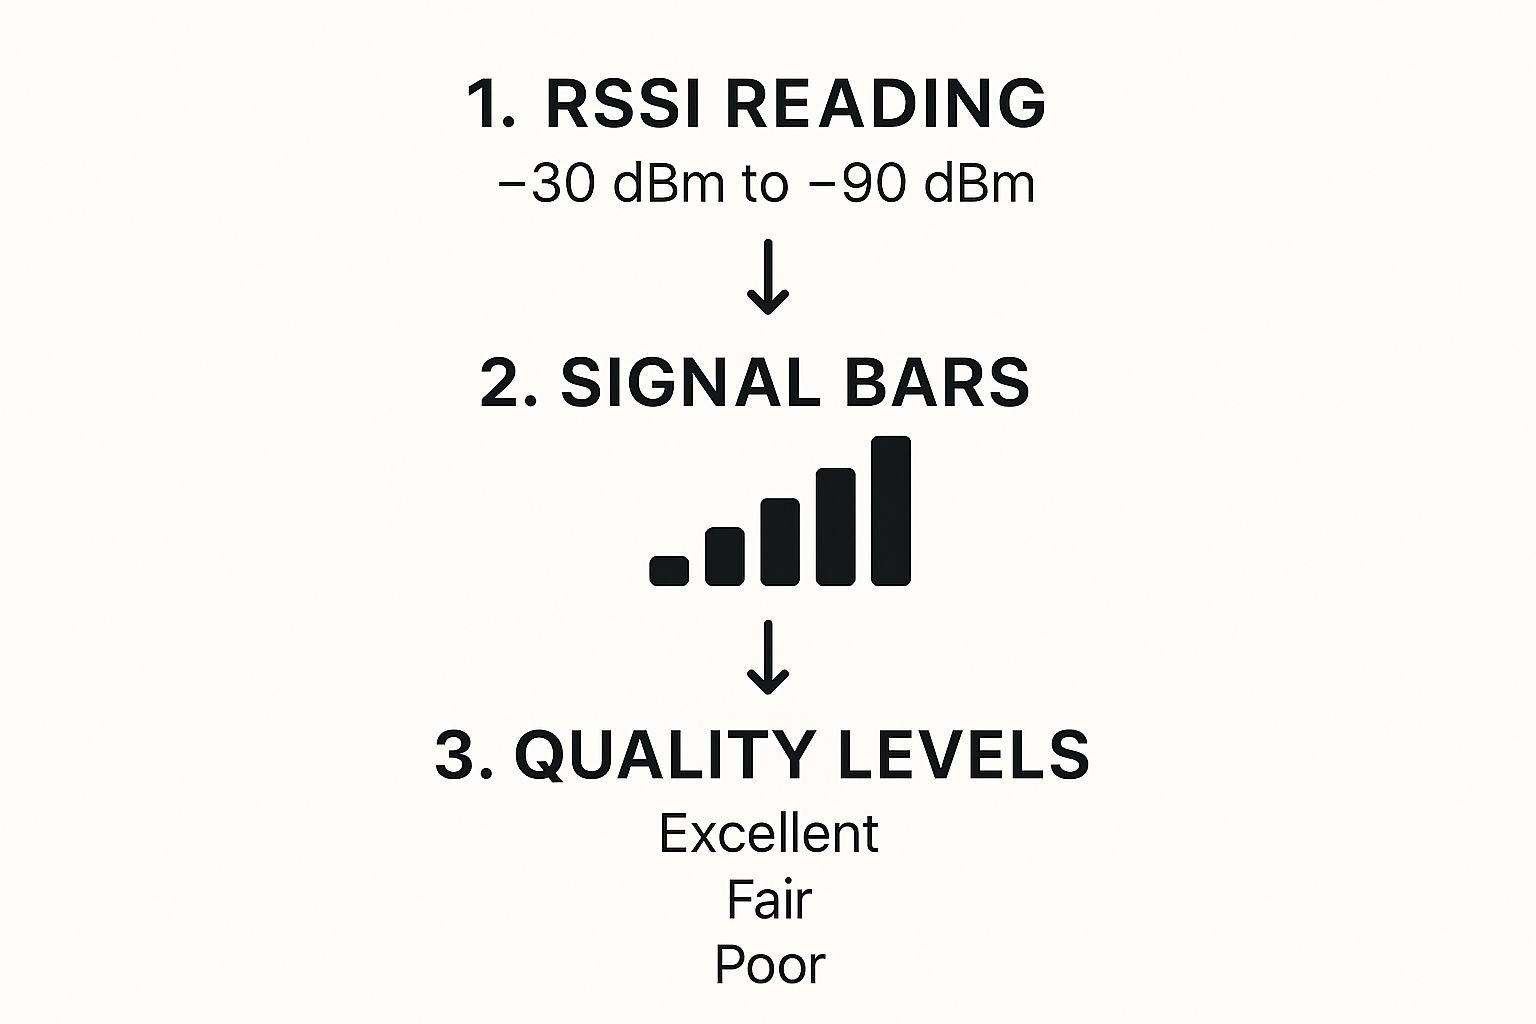
As you can see, what seems like a small drop in the number can be the difference between smooth streaming and constant buffering.
Where these tools really shine, though, is with a feature called Wi-Fi heatmapping. You can upload a floor plan of your space, then walk around with your laptop while the software measures the signal strength at different points. The result is a color-coded map that instantly shows you where your Wi-Fi is strong (hot spots) and where it's weak (cold spots).
It takes the guesswork completely out of the equation. You can see precisely where your dead zones are, making it a breeze to figure out the best place to move your router or where to add a mesh node or extender.
Checking WiFi Signal Health on a Mac

If you're on a Mac, you've got a fantastic, built-in network analysis tool at your fingertips. It’s tucked away, but it's far more insightful than the basic Wi-Fi bars in your menu bar. This little utility gives you the hard data you need to see what's really going on with your connection.
Finding it is easy, but not exactly obvious. Just hold down the Option key on your keyboard and click the Wi-Fi icon in the menu bar. This simple trick reveals a hidden menu with a lot more detail. From there, find and click "Open Wireless Diagnostics…"
A new window will pop up. You can safely ignore the wizard that appears and head straight for the good stuff. Go to the menu bar at the top of your screen, click on "Window," and then select "Performance." This is where the magic happens. A live, floating graph will appear, charting three critical metrics in real time.
Interpreting Your Mac's WiFi Performance
This small window is your new best friend for troubleshooting. It gives you a continuous, live snapshot of your connection's health. I like to keep it open while I walk around a room or office to see exactly where the signal weakens or interference spikes.
Here’s a breakdown of what you're seeing on the Performance graph:
- RSSI (Received Signal Strength Indicator): This is the raw power of your signal, measured in dBm. Just like we covered earlier, a number closer to 0 is better. Anything around -45 dBm is fantastic, but if you see it dipping to -70 dBm or lower, you're in for a rough time with drops and buffering.
- Noise: Think of this as background static from other electronics—microwaves, cordless phones, even your neighbor's router. You want this number to be as low (as negative) as possible, ideally below -90 dBm. A high noise level, like -80 dBm, can cripple your Wi-Fi speeds even if your RSSI looks strong.
- Tx Rate (Transmit Rate): This is your connection speed, or the rate at which your Mac is sending data back to the router, measured in Mbps. The higher, the better.
Let's say you're on an important video call and things start getting choppy. You glance at the Performance window. Your RSSI is a solid -55 dBm, but the Tx Rate has tanked. That's a huge clue—the problem isn't a weak signal, but more likely interference or network congestion.
Finding the Best WiFi Channel
The Wireless Diagnostics tool has one more trick up its sleeve. Head back to the "Window" menu and this time, select "Scan." A new window will open up, showing you a list of every Wi-Fi network your Mac can see.
This Scan tool is a lifesaver for tackling channel congestion, one of the most common culprits of slow Wi-Fi. It clearly shows you which channels are packed with your neighbors' networks.
If you find that your router and five others are all fighting over channel 6, you’ve probably found the source of your problems. The tool even recommends the best, least-crowded channels. You can then log into your router's admin settings and manually switch to one of those channels. This simple adjustment often provides an immediate, noticeable boost in performance and stability.
Using Your Smartphone to Map Out Wi-Fi Coverage
Believe it or not, the most practical tool for measuring your Wi-Fi signal is probably in your pocket right now. Your smartphone, armed with the right app, transforms into a surprisingly powerful network analyzer. This lets you perform a simple "walk-around test" to create a quick mental map of your home or office's Wi-Fi coverage.
It wasn't always this easy. Not long ago, getting these kinds of measurements required complex, specialized equipment. Professionals relied on things like tri-axial antennas to get precise radio frequency (RF) readings, a process detailed in old Industry Canada studies from the 2010s. Thankfully, technology has come a long way, and your phone can now give you a pocket-sized version of that same capability.
Finding the Right Wi-Fi Analyzer App
The best app for the job really depends on whether you have an iPhone or an Android. Android gives developers much more direct access to the phone's Wi-Fi hardware, so you'll find a wider variety of feature-rich apps.
-
For Android: I'm a big fan of apps like WiFi Analyzer or the mobile version of NetSpot. They do more than just show you signal strength; they give you a real-time dBm reading and show you which Wi-Fi channels are crowded. Seeing that congestion is a game-changer for troubleshooting interference from your neighbors' networks.
-
For iPhone: Apple keeps things locked down for security reasons, which limits what third-party apps can access. But there's a fantastic, little-known feature hidden in Apple’s own AirPort Utility app. To turn it on, go to your iPhone’s Settings, scroll down to AirPort Utility, and flip the switch for "Wi-Fi Scanner." Now, when you open the app, you can start a scan and see the raw dBm readings for every network in range.
Once you have your app running, just start walking. Watch the dBm value as you move around your space. You'll see the numbers change in real-time. Make a note of where the signal drops off a cliff—like going from a strong -55 dBm in your office to a barely-there -75 dBm in the kitchen. Those are your dead zones.
Creating a Wi-Fi Heatmap
What you're doing with this walk-around test is essentially creating a manual Wi-Fi heatmap. As you move from the living room to the bedroom, you’re physically mapping out where the signal is great, where it’s just okay, and where it's completely unusable.
You might discover, for example, that the signal directly behind your refrigerator—a giant metal box—is 10-15 dBm weaker than it is just a few feet away. That’s the kind of practical, hands-on insight you can't get from just guessing.
This is why understanding the importance of network design and verification with heatmapping is so crucial for a stable network. Armed with the data you just collected, you can make smarter decisions, whether that means moving your router to a more central location or finally buying that mesh system to kill those dead zones for good.
Turning Signal Data into Real-World Fixes
You’ve got the numbers, but what do they actually mean for your Wi-Fi? Knowing how to measure your signal is just the first step. The real magic happens when you use those dBm readings to make smart changes that actually fix your connection.
It's a classic, frustrating scenario: your analyzer app shows a fantastic -55 dBm signal, yet your video calls are still a pixelated mess. This is a tell-tale sign that raw signal strength isn't the villain here. The problem is likely something sneakier, like network interference or channel congestion.
Strong Signal but Slow Speeds?
When the signal looks great but performance is poor, it's time to put on your detective hat. The usual suspect? Wi-Fi channel congestion.
Think of your Wi-Fi channel as a lane on a highway. If you and all your neighbors are trying to merge into the same lane at rush hour, you get a traffic jam. Everyone slows to a crawl.
Your Wi-Fi analyzer tool is your traffic map. It will show you exactly which channels are gridlocked. If you see your network is sharing channel 6 with five neighboring networks, you've found the bottleneck. Often, the fix is as simple as logging into your router’s admin settings and manually switching to a clearer channel, like 1 or 11 on the 2.4 GHz band.
It's also worth remembering that signal strength and speed aren't a one-to-one relationship. A strong signal enables high speeds, but doesn't guarantee them. While a signal above -65 dBm is great for high-speed tasks, dropping below -75 dBm often causes your devices to downshift their speed just to keep the connection stable.
Weak Signal in Specific Rooms?
What if your walk-around test uncovered a dreaded dead zone? Maybe the back bedroom is getting a pathetic -80 dBm reading. This isn't an interference issue; it's a classic coverage problem.
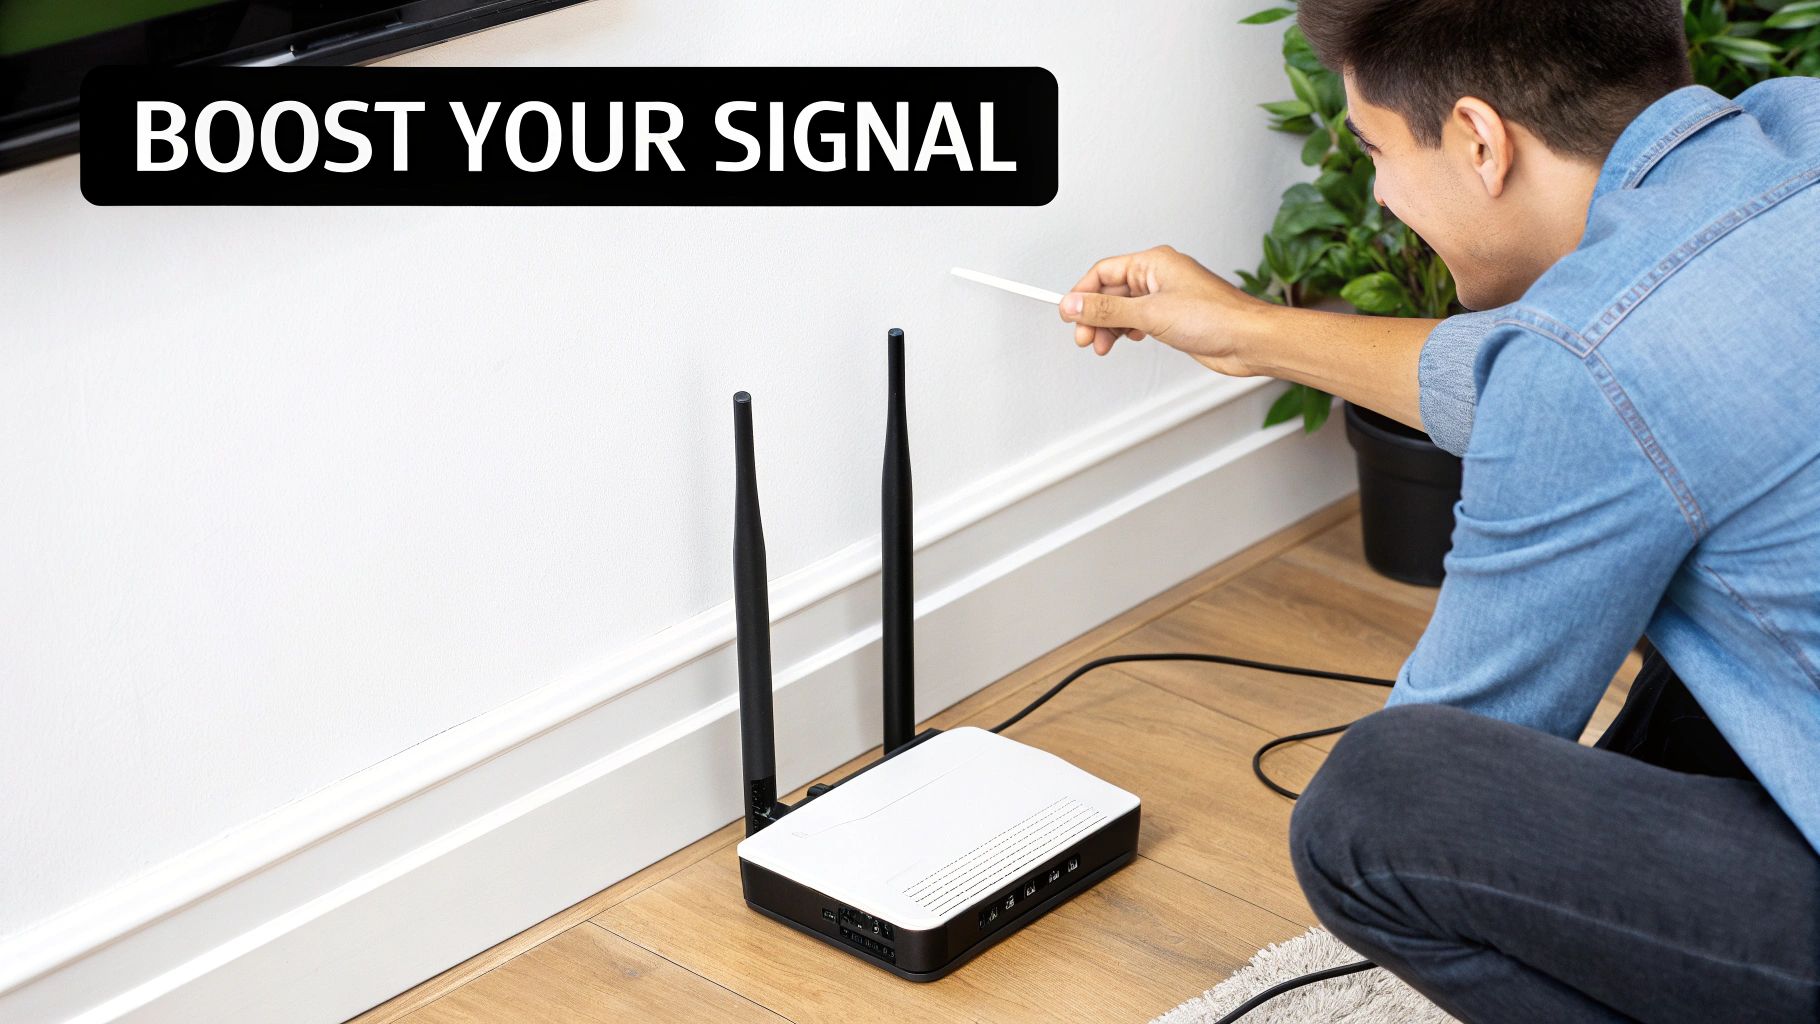
Before opening your wallet, try the free fix first: move your router. Getting it into a more central, elevated spot—away from thick walls or a big metal filing cabinet—can work wonders. I've seen this simple trick solve countless Wi-Fi woes.
If repositioning doesn't cut it, you’ve got two solid options:
- One problem room? A basic Wi-Fi extender can often provide the boost you need to bridge that single gap.
- Multiple dead zones? A mesh Wi-Fi system is the modern gold standard. It replaces your single router with multiple nodes that blanket your home in one seamless network.
By using your measurement data, you can make an informed choice. You'll know whether you need to clear up your Wi-Fi channel's "air traffic" or if you need to physically extend your network's reach.
Understanding your network's physical layout is crucial. For a deeper dive, check out our guide on how to improve Wi-Fi coverage.
A reliable network is the backbone of a modern smart home, supporting everything from your laptop to essential safety devices like WiFi smoke alarm systems. By methodically identifying the type of problem you have, you can apply the right fix and finally get the reliable performance you’re paying for.
Got Questions About Wi-Fi Signal Strength?
Even after you've picked your tools and started measuring, you're bound to run into some head-scratchers. Let's dig into some of the most common questions people ask when they start analyzing their Wi-Fi, with clear answers to help you solve those nagging network mysteries.
What’s a Good dBm Reading for Wi-Fi?
This is probably the number one question I get, and the honest answer is: it depends on what you’re doing.
If you’re aiming for flawless 4K streaming or trying to win an online gaming match, you need a top-tier signal, somewhere between -30 and -50 dBm. That’s the gold standard—a powerful, stable connection where your performance will be maxed out.
For most day-to-day activities like video calls, web browsing, and HD streaming, a signal from -51 to -67 dBm is perfectly fine. It's still a very good connection that won’t give you any trouble. It’s when you dip below -67 dBm that things can get dicey. At -70 dBm and weaker, you’re officially in the "weak signal" zone, where you can expect sluggish speeds and frustrating dropouts.
Here's the key takeaway: -80 dBm is pretty much the bare minimum for any kind of functional connection. Anything weaker than that, and your devices will have a hard time just staying on the network.
Can I Measure Wi-Fi Signal Without an App?
You sure can. You don't always need to download a third-party program just to get a quick read on your connection's health. Both Windows and macOS have some handy built-in tools that work in a pinch.
- For Windows users: You can use the Command Prompt. Just type in
netsh wlan show interfaces, and it will spit out a signal quality reading as a percentage. Quick and easy. - For Mac users: This one’s even simpler. Hold down the Option key and click the Wi-Fi icon in your menu bar. You'll get a dropdown with all sorts of detailed info, including the raw RSSI value in dBm.
These native tools are fantastic for a quick spot-check. But remember, they only give you a snapshot of that exact moment. For anything more advanced, like mapping coverage across your home or figuring out channel interference from your neighbors, you'll still need a dedicated app.
My Signal Is Strong, So Why Is My Internet So Slow?
This one is maddeningly common. Your analyzer shows a great -55 dBm signal, but opening a simple webpage feels like you’re back on dial-up. What gives?
This scenario almost always points to one of two things: Wi-Fi interference or an issue with your internet service provider (ISP).
Think of Wi-Fi channels like lanes on a highway. If you and all your neighbors are broadcasting on the same channel, it creates a digital traffic jam. Your data gets stuck waiting its turn, and everything grinds to a halt. The other possibility is that your Wi-Fi isn't the problem at all. The bottleneck could be an old, underpowered router that can't keep up with modern speeds, or simply a problem with the internet plan you're paying for.
At Clouddle Inc, we specialize in designing and managing robust, high-performance Wi-Fi networks that eliminate these common frustrations. Our Network-as-a-Service solutions ensure your business has the reliable connectivity it needs, backed by 24/7 support. Learn more about how we can optimize your network infrastructure today.