
You can get a quick read on your network's latency using the built-in ping and traceroute commands right from your computer's terminal or command prompt. These simple tools send a small packet of data to a server and time how long it takes to come back. This measurement gives you a direct, no-nonsense number for the delay, often called the Round-Trip Time (RTT).
Why Network Latency Actually Matters
Before you start running tests, it’s helpful to understand what network latency is and why it's so much more than just "lag." It’s the time it takes for data to travel from your device to a server and back again. We're talking milliseconds here, but even tiny delays can have a huge impact on your daily online activities.
This delay is the culprit behind those frustrating stutters in your video calls, the unresponsiveness in online games, and that annoying pause after you click a link. To really get a handle on minimizing these issues, it helps to first understand What is Network Latency and its core principles. For anyone who depends on a fast, reliable internet connection, knowing how to check your latency is a must-have skill.
This visual gives a great example of how latency can affect a remote worker during a video call, where even small delays can completely disrupt the flow of conversation.
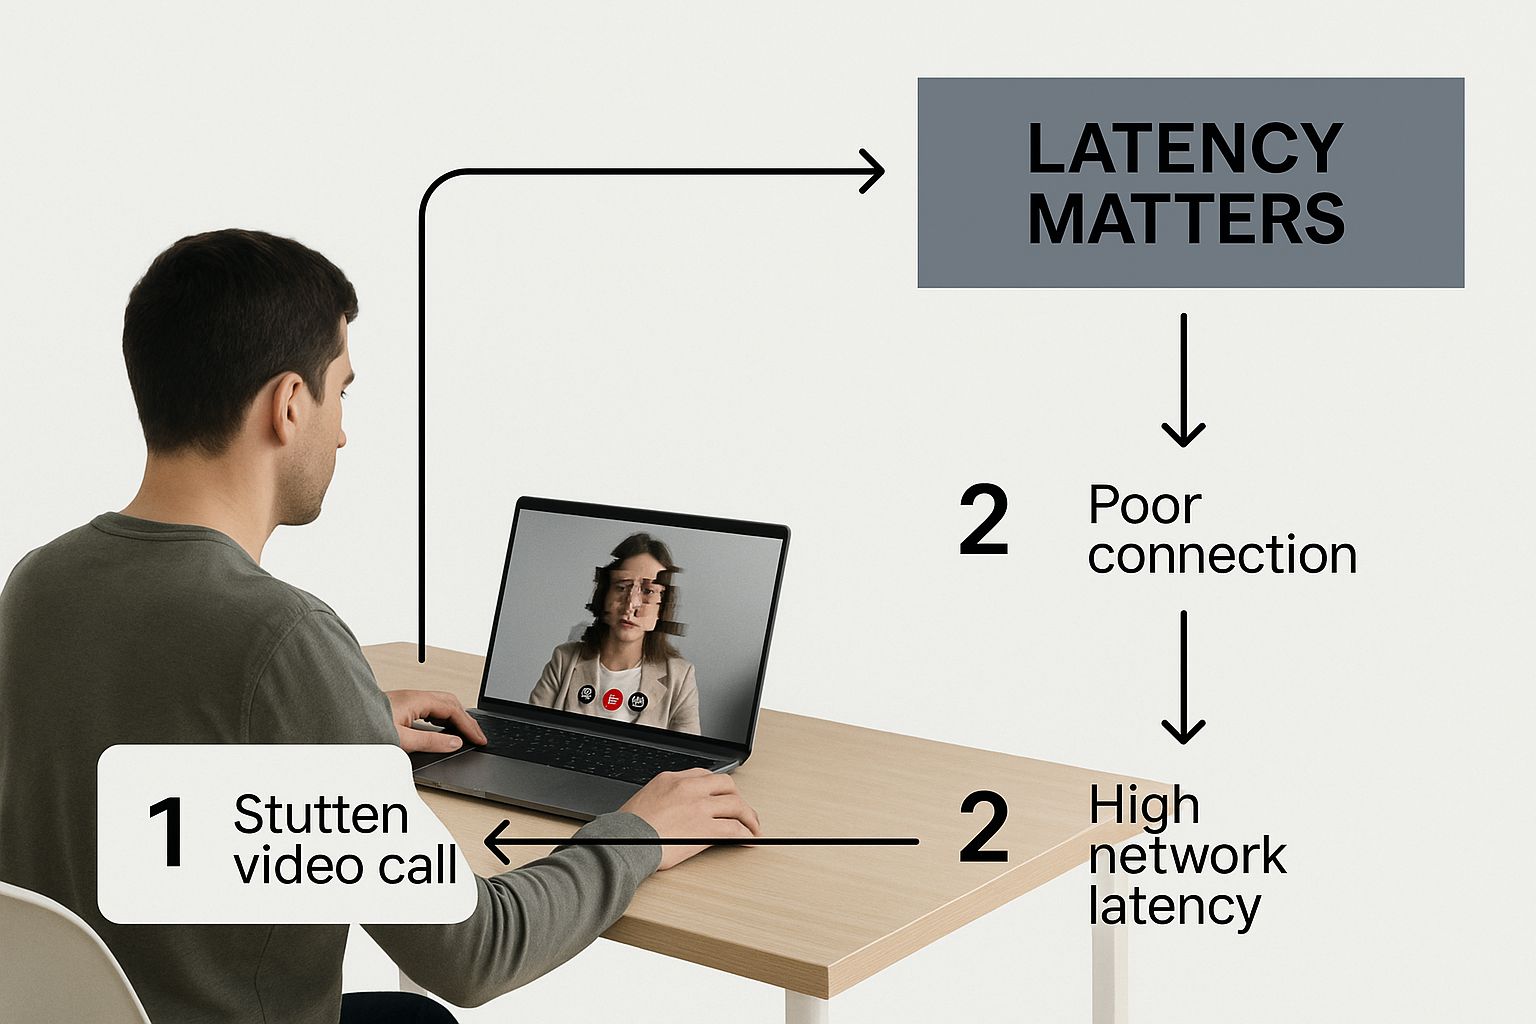
As the image shows, a seamless digital experience is directly tied to keeping that latency as low as possible.
The Impact of Round-Trip Time
One of the most practical ways to measure network latency is by calculating the Round-Trip Time (RTT). This is the total time, in milliseconds, that a data packet takes to travel to a destination and return to you.
RTT is the tangible proof of your network's performance. It’s not just a number; it’s the difference between a seamless video conference and a conversation filled with awkward pauses and interruptions.
For instance, Microsoft is constantly measuring the RTT between its global Azure data centers to guarantee performance for real-time services. Their public data reveals just how much latency can vary between regions, which directly affects everything from financial transactions to cloud gaming. You can dive deeper into how global networks manage this on Microsoft's official documentation. This real-world example shows why keeping RTT low is non-negotiable for modern business.
Using Simple Commands to Uncover Latency Issues
You don't always need complex software to start diagnosing a laggy connection. Your computer has some powerful tools built right in, and the most fundamental of these is the ping command. Think of it as a quick sonar ping for your network.
When you run this command, you're sending a tiny data packet—an ICMP echo request—out to a server and timing how long it takes to get a response. That round-trip time is your latency, giving you an immediate snapshot of your connection's performance.
It's easy to do. Just open your Command Prompt (on Windows) or Terminal (on macOS/Linux) and type something like ping google.com. You'll see a series of replies, each with a time measured in milliseconds (ms). That’s your real-time latency to Google's servers.
Reading Ping Results Like a Pro
The output from a ping test tells a bigger story than just a single number. To really understand what's happening, you need to look at a few key metrics:
- Time (ms): This is the direct latency for each packet sent. Your goal is to see consistently low numbers.
- Packet Loss: Did you send ten packets but only get nine replies? That’s 10% packet loss. For things like video calls or online gaming, anything above 0% can cause noticeable stutters and drops.
- Consistency: Look at the time values. Are they stable and close together (like 25ms, 26ms, 25ms)? Or are they all over the map (like 30ms, 250ms, 45ms)? Big swings, often called jitter, can be just as frustrating as high latency.
A stable connection with 40ms latency is often better than an unstable one that jumps between 15ms and 200ms. Consistency is just as important as speed for a quality online experience.
Tracing the Path with Traceroute
So what do you do if your ping times are high and you have no idea why? The next tool in your arsenal is traceroute (or tracert on a Windows machine). This command maps out the entire digital journey your data takes to reach its destination.
Instead of just giving you the final round-trip time, traceroute shows you every single "hop," or router, your data passes through and measures the latency at each stop. It’s like getting a turn-by-turn itinerary of your data's road trip.
If you spot a huge jump in latency at a particular hop, you’ve probably found the bottleneck. The delay could be coming from your local network, your ISP, or even a server on the other side of the world. Pinpointing where the lag is happening is the first real step toward fixing it. For a closer look at more advanced techniques, you can explore our guide on how to troubleshoot network issues.
Making Sense of Your Latency Test Results
So you've run a ping or a traceroute. Now what? The real skill isn't just getting the numbers; it's understanding what they're telling you about your network's health. A single high number doesn't automatically mean your connection is toast. Context is everything.
What you’re really hunting for are patterns. Is the latency consistently high, or does it only spike during your team's daily video stand-up? A random, one-off spike could just be a bit of traffic congestion somewhere out on the internet—something you can't do much about. But if you see high numbers creeping in day after day, especially on the first few hops in a traceroute, the problem is probably much closer to home.
Good vs. Bad Latency: What to Look For
Not all latency is a deal-breaker. What’s considered "good" really comes down to what you're trying to do. Knowing these general benchmarks can help you figure out if your results are pointing to a real issue.
- Under 30ms: This is the gold standard. It's fantastic for anything where split-seconds matter, like competitive online gaming or high-frequency trading.
- 30ms to 60ms: For most of us, this is a great place to be. Your video calls will be smooth, streaming is seamless, and browsing feels snappy.
- 60ms to 100ms: Things are still usable here, but you might start to feel a little sluggishness. Video calls could have a slight delay, and online games won't feel quite as responsive.
- Over 100ms: This is where you'll definitely notice a problem. Lag in games becomes a real handicap, you'll see more buffering on videos, and everyday web browsing can feel frustrating.
In professional IT monitoring, we don't just look at one-off metrics. A single data point, like 42ms at 10:15 AM, doesn't tell the whole story. The real insights come from analyzing trends over time. We often track averages or, even better, isolate the worst 5% of latency readings. This helps us spot those recurring hiccups that degrade the user experience. You can dive deeper into how pros use network statistics for performance analysis.
The key takeaway is to look beyond a single test. Run multiple tests throughout the day to build a clear picture. A high latency reading at 3 PM might be normal network congestion, but a high reading at 3 AM could point to a more serious underlying issue.
Advanced Tools for a Deeper Network Analysis
When simple commands like ping and traceroute aren’t cutting it, you need to bring in the heavy hitters. Tricky network issues often hide in the details, and advanced tools are what you need to uncover them. They go beyond a quick snapshot, offering a continuous, dynamic picture of your network’s health.
One of my go-to tools for this is MTR (My Traceroute). It’s a fantastic hybrid that combines the functionality of ping and traceroute into a single, live report. Instead of just mapping the path once, MTR constantly sends packets to every hop, giving you real-time data on latency and packet loss along the entire route. This is an absolute lifesaver for catching those intermittent problems that a standard traceroute would almost certainly miss.
Getting a Granular View
For those times when you need to see everything—and I mean every single packet—it's time for a packet analyzer. The undisputed champion in this arena is Wireshark. It captures and displays every piece of data zipping across your network connection.
I'll admit, Wireshark’s interface can look a bit overwhelming at first. But once you get the hang of it, it’s an incredibly powerful tool for diagnosing complex, application-specific issues. You can filter the noise to see precisely what’s causing a slowdown, whether it’s a chatty database or a misbehaving server. Think of it as putting a stethoscope on your network to hear every single detail.
If you're looking for enterprise-grade solutions, this guide to the Top Infrastructure Monitoring Tools offers a great breakdown of platforms that can automate this kind of deep analysis for you.
Using Web-Based Testing Services
Sometimes, the bottleneck isn't on your end at all. The issue might be how your network talks to the rest of the world. Web-based testing services are a fantastic way to measure your latency from multiple geographic locations at once. These tools run tests from servers scattered around the globe, helping you quickly figure out if a slowdown is a local hiccup or a much broader problem.
Pro Tip: Testing from different locations is absolutely critical if you have an international audience. Great performance in New York means nothing to a user struggling to connect from Tokyo. This global perspective is key to optimizing the experience for everyone.
For any business that depends on solid performance, investing in one of the best network monitoring software solutions is a no-brainer. These platforms put your monitoring on autopilot—running constant checks, tracking historical data, and alerting you the moment performance dips. It’s all about getting ahead of problems before they ever impact your users.
Pinpointing and Fixing Common Causes of High Latency
So, you’ve run your tests and confirmed you have a latency problem. What now? The good news is that high latency usually boils down to just a few common culprits. The trick is figuring out if the problem is in your house, with your Internet Service Provider (ISP), or at the destination server.
Let's start with what you can control: your own setup. One of the most common issues I see, especially in dense areas like apartment buildings or offices, is an overloaded Wi-Fi channel. If your router is fighting for airtime with a dozen others, you’re going to get interference. A simple Wi-Fi analyzer app can show you which channels are crowded so you can switch to a clearer one.
Don't forget to look at your hardware, either. An ancient router just can't keep up with modern internet speeds, creating a bottleneck that no amount of software tweaking can fix.
Optimizing Your Local Network
If you've checked for Wi-Fi congestion and your gear seems okay, it's time to dig a little deeper into your immediate environment. These are the quick fixes that often make a surprisingly big difference:
- Get closer to your router. It sounds obvious, but physical distance and obstacles like thick walls are absolute killers for Wi-Fi signals and a major cause of latency.
- Plug in with an Ethernet cable. When performance is critical, nothing beats a wired connection. It's almost always going to be more stable and faster than wireless.
- Update your router's firmware. Manufacturers are always releasing updates to squash bugs and improve performance. A quick update can sometimes be all it takes to smooth things out.
Making these small adjustments can often be enough to eliminate those frustrating lag spikes. If you want to go further, our guide on how to improve network performance gets into more advanced strategies for fine-tuning your setup.
When the Problem Is Beyond Your Control
Sometimes, the source of the lag isn't inside your home or office at all. Your ISP's network infrastructure is the foundation of your internet experience, and if that foundation is shaky, you're going to feel it.
You can have the best equipment in the world, but if the broader internet infrastructure is slow, you're fighting an uphill battle. No amount of tweaking on your end can fully compensate for a poor connection from your provider.
The impact of infrastructure is massive. Over the last decade, we've seen upstream latency drop from painful peaks of 950 ms down to a much more reasonable 120 ms globally. This improvement is almost entirely thanks to big-picture upgrades like widespread fiber optic rollouts. You can see the full data on these long-term performance improvements.
If your traceroute tests consistently show high latency a few hops after your connection leaves your home network, that’s a huge red flag. At that point, it’s time to pick up the phone and talk to your ISP—and now you have the data to back up your claim.
Common Questions About Network Latency
We get a lot of questions about latency, so let's clear up a few common points of confusion.
What's the Real Difference Between Latency and Bandwidth?
It's easy to mix these two up, but they measure completely different things. Think of it like a highway: bandwidth is how many lanes the highway has. It's the total amount of data you can move at once, usually measured in megabits per second (Mbps).
Latency, on the other hand, is the speed limit on that highway. It’s the time it takes for a single piece of data to get from your computer to a server and back again. We measure this delay in milliseconds (ms).
You can have a massive, 10-lane highway (high bandwidth), but if there's a 20 mph speed limit (high latency), things are still going to feel slow.
Can I Have High Bandwidth and Still Suffer from Bad Latency?
Absolutely. This is a classic scenario we see all the time. You might be paying for a gigabit internet plan but still find your video calls stuttering or online games unplayable.
So, what gives? The problem often isn't your data plan but other factors:
- Physical Distance: Data still has to travel. If you're in New York trying to connect to a server in Tokyo, there will be a noticeable delay.
- Network Congestion: Your local network or even your ISP's network can get jammed up with traffic, just like rush hour.
- Wi-Fi Issues: A weak or interference-prone Wi-Fi signal can be a major source of latency, even if your internet connection itself is solid.
This is exactly why serious online gamers obsess over low latency far more than they do about having the absolute highest bandwidth. A few milliseconds can make all the difference.
How Often Should I Bother Measuring My Network Latency?
You definitely don't need to check it every day. The best time to measure latency is when you're actively trying to solve a problem.
If you're noticing lag, slow browsing, or choppy video streams, that's your cue. Try testing it at different times of the day—morning, afternoon, and peak evening hours. This will help you figure out if the issue is a constant problem or just happening when everyone in your neighborhood is online.
At Clouddle Inc, we specialize in designing and managing high-performance networks built to minimize latency for businesses. Learn how our managed IT solutions can improve your operations.


0 Comments